Hallo liebe Freifunk Gemeinde,
Schön ist der Bug auch schon da angekommen … Frag mal in Bremen nach … Da ist irgenwo ein Bug mit dem Server VPN …
Diese Infos habe ich in der Letzten FF BREMEN Besprechung gehöhrt und es wurde auch schon der Fehler rekonstruiert… so das mal eben fast alle Knoten neugestartet haben…
lg
ja das ist normal, dass sie neu starten
1a) einige Communities/firmwares haben daily reboot
im Zweifelsfall ist „reboot“ besser als „freeze“
viele Communities haben auf Grund ihrer Domaingröße (z.B. „mehr als 250 Knoten in einer L2-Domain“) Stabilitätsprobleme. Jenseits der 400 Knoten in einer Domain wird’s dann evtl. so dramatisch wie Du beschreibst.
offen 10:40PM - 04 May 16 UTC
geschlossen 03:20PM - 05 Jun 18 UTC
0. type: bug
As I've reported on IRC we at FFRN can observe a higher load and frequent reboot… s on nearly 30% of our nodes.This happens if we reach a specific number of nodes and clients in our network. We have debugged this issue for over a month now and we think we've limited the possible sources.
Let's start with our observations. The first time we became really aware of this problem was the moment we reached the number of 1500 clients in our network spread over nearly 700 nodes. This happened around the first of April this year. But after analyzing the problem we think it started even earlier with some "random" reboots we were analyzing too.
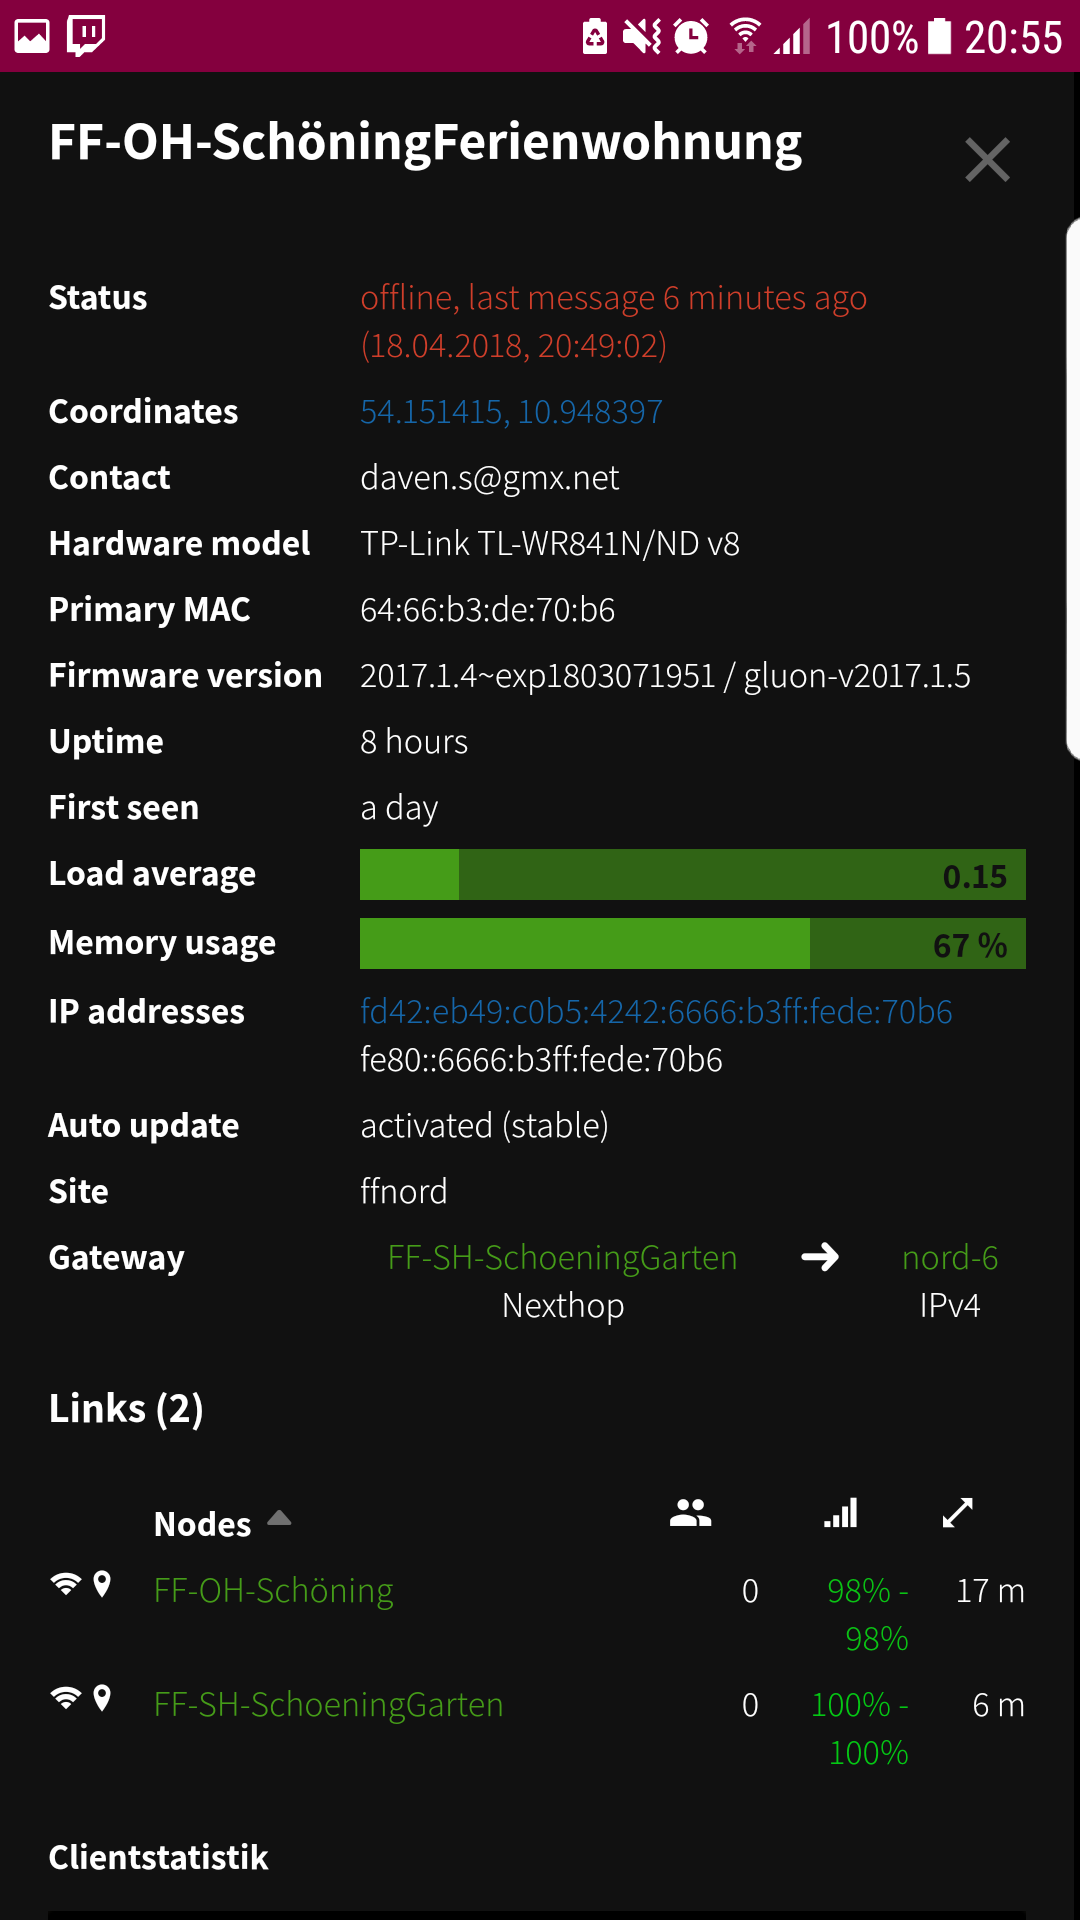
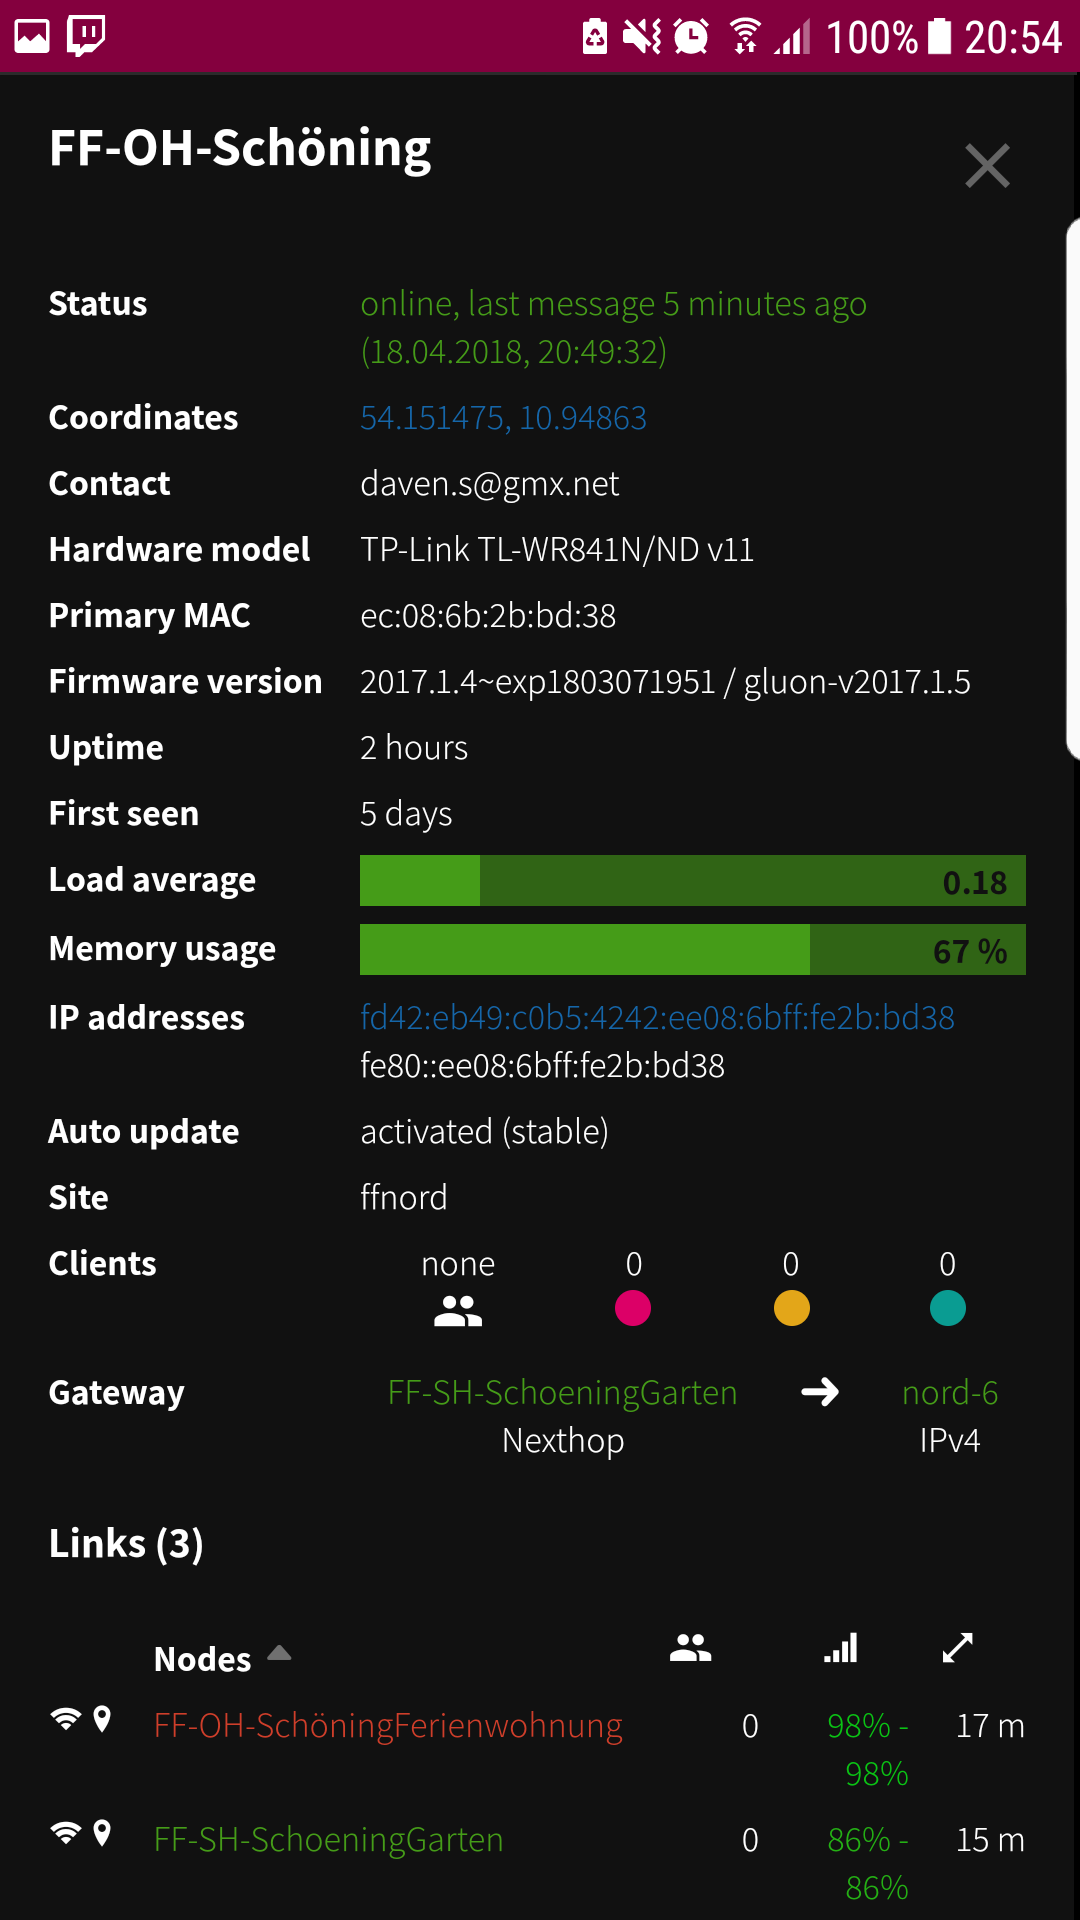
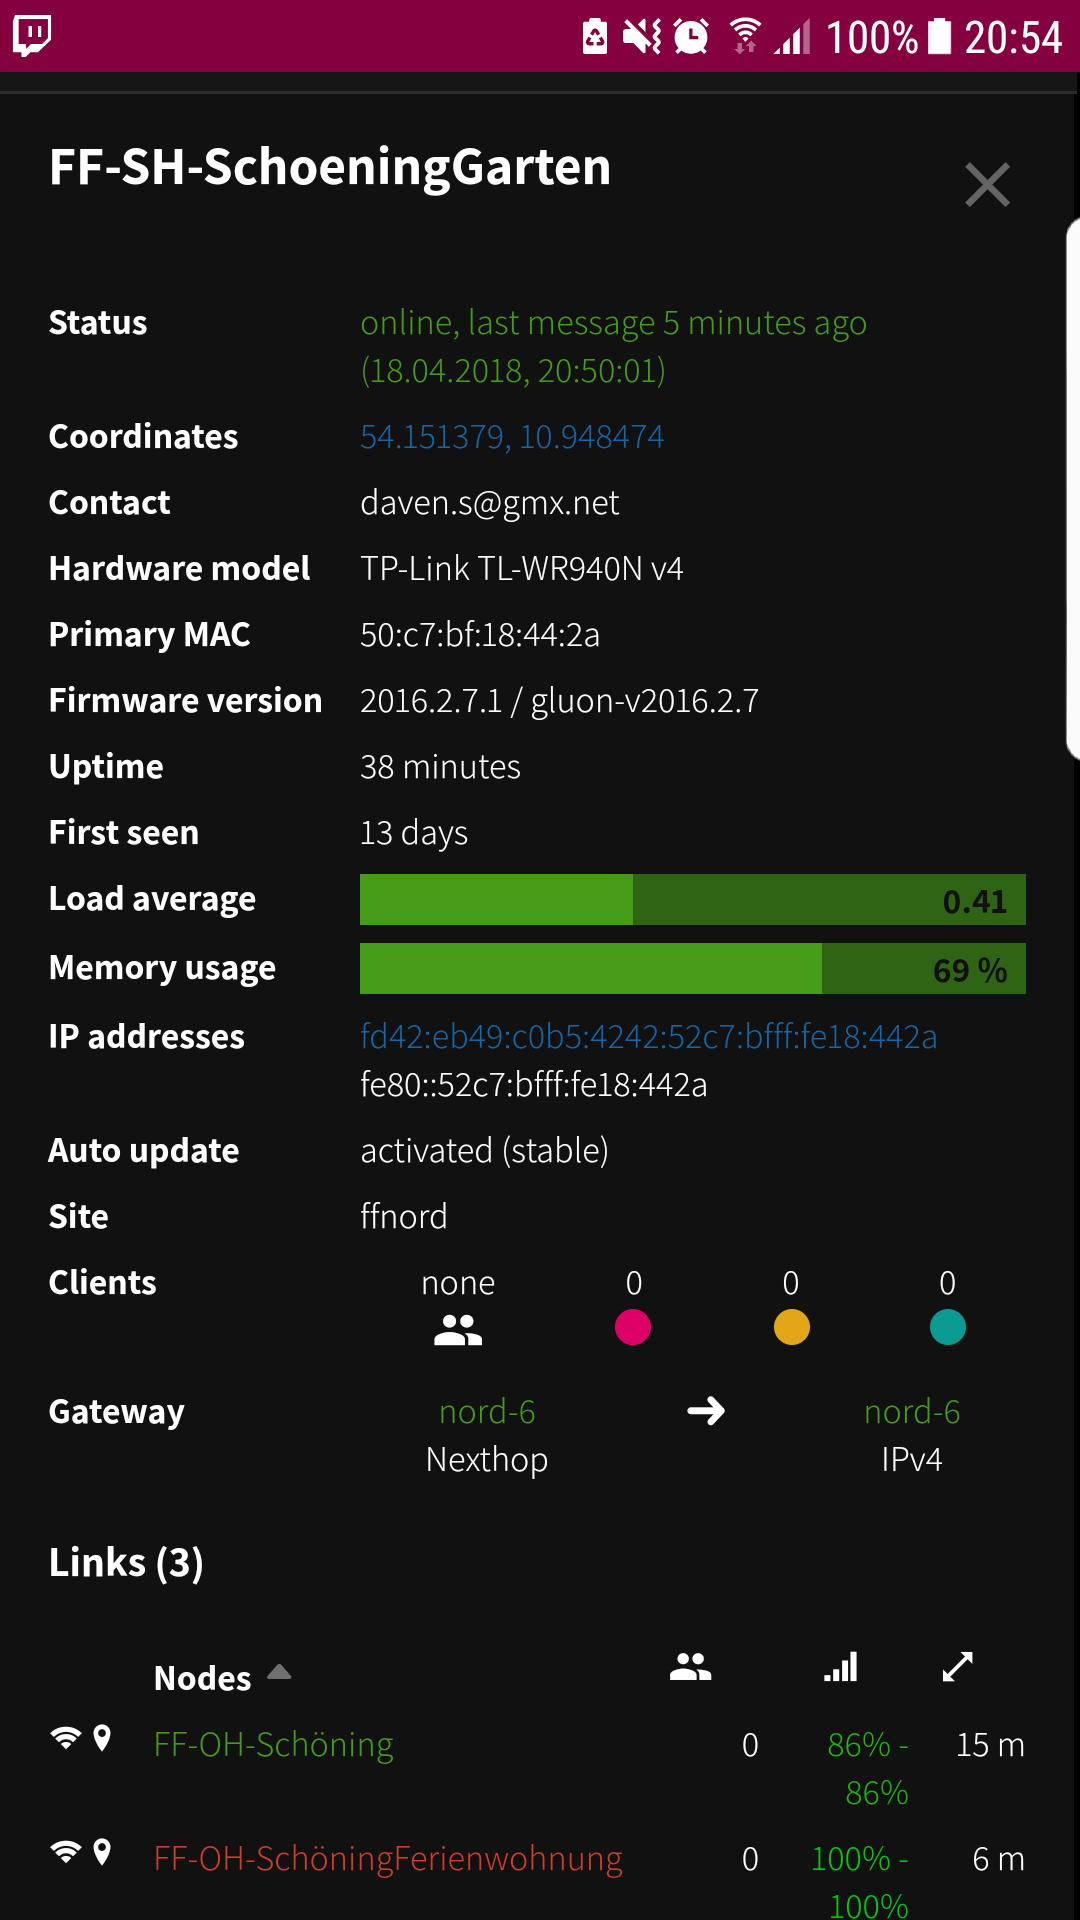
The first thing we observed was, that the majority of the affected nodes are the small tl-wr841 devices. This does not mean, that the bigger nodes like a tl-wr1043 are not affected, the problem just hasn't a big enough impact on them. But interestingly not all of these nodes where affected, only a portion of 30% is showing all the characteristics of this problem. All other nodes are running without any interruptions.
On an effected node we can see the following: If we reach more that 3000 entries in the transglobal table the problems start and if the number is falling under this mark the problems are mainly gone. Such a node shows a increased average load of around 0.45 to 0.9 compared with 0.2 to 0.25 of an not effected node. But the load also starts to peak to values of 2-4 in the time we are above the mark on the problematic nodes. And sometimes every few hours or every few minutes the node reboots.
Another interesting observation is, that affected nodes get alot of more free RAM when the problems start. The RAM usage decreases from the healthy default of around 85% (on a 841) to 75%-80%.
On a TL-1043 it looks like this:

On a TL-841v9 it looks like this:

At all times we can't see a single process making problems or using more RAM than usual, only the load and the system CPU utilization showed that something went wrong. So we though that the problem has to be in the kernel or in combination with the RAM.
So we started to debug the problems and first we tried to locate a pattern in our statistics to limit the number of possible sources for the problem. There were alot of other ideas we tested but all with nearly no effect. So the most promising was the TG table. But it's not the number of entries because we can't find any limits near this number in the sources and also some other things are speaking against it. So the problem has to be in the processing of the entries or somewhere else.
After that we found out that something in combination with the TG tabel, we think it's the writing of the table to tmpfs, was causing new page allocations. These page allocation couldn't be satisfied by
the available RAM so some parts of the page cache are cleaned up. This cache holds the frequent running scrips of the system so after that the system has to start rereading them. And here the first problem starts. The system is rereading the disk without an end. I've attached a log file for a affected and a not affected node.
[notbroken.log.txt](https://github.com/freifunk-gluon/gluon/files/249698/notbroken.log.txt)
[broken.log.txt](https://github.com/freifunk-gluon/gluon/files/249700/broken.log.txt)
If this continues for a while and then we try to write again our TG table, it could be that we run in the vm.dirty_ration which blocks the IO of all processes making everything even worse.
So to solve this problem we started optimizing alot of parameters in the sysfs. He is a list of all current additional options we set.
> net.ipv6.neigh.default.gc_interval=60
> net.ipv6.neigh.default.gc_stale_time=120
> net.ipv6.neigh.default.gc_thresh1=64
> net.ipv6.neigh.default.gc_thresh2=128
> net.ipv6.neigh.default.gc_thresh3=512
>
> net.ipv4.neigh.default.gc_interval=60
> net.ipv4.neigh.default.gc_stale_time=120
> net.ipv4.neigh.default.gc_thresh1=64
> net.ipv4.neigh.default.gc_thresh2=128
> net.ipv4.neigh.default.gc_thresh3=512
>
> vm.min_free_kbytes=1024
> vm.dirty_background_ratio=5
> vm.dirty_ratio=30
> vm.dirty_expire_centisecs=0
Here we save some RAM by using smaller neighbour tables, we increased the min_free_kbytes value to have a bigger buffer for allocation problems, we set down the dirty_background_ration so the system starts writing stuff to disk in background earlier (this is no problem because we write to a ramdisk) we set up the dirty_ration to prevent a whole IO lock and the dirty_expire_centisecs means that we write back the stuff only when we reach the background_ration and not after a time limit to prevent useless write.
With this changes we could increase the performance, we have decreased the load of effected nodes even under the average value for not effected nodes. So maybe some of these options are also relevant without this issue. To get even more free ram some people tried to disable haveged, this also makes it more stable, because we have more free RAM.
Then we saw that the community in Hamburg has a bigger network with alot more clients and nodes but doesn't look affected by the problem. So we analysed the site.conf and found out that the mesh VLAN feature we were using (Hamburg not) was causing double entries for every node. One with VID -1 and one with VID 0. This isn't that great.
Then we flashed a test node with the firmware from Hamburg. The first difference is that our firmware is based on gluon 2016.1.3 and the one from Hamburg is the version 2015.1.2. So there are a few differences.
But short back to the TG table. The TG table from Hamburg was around 3700 entrys long without the problem occurring. So the problem must be something that was changed between the versions. As the 2016 versions are based on OpenWRT CC and not on BB like 2015 this could be alot. But we think its not something on the OpenWRT base system. It has to be something more freifunk specific.
So we looked again on the process list of a node with our firmware and one with the firmware from Hamburg.
Her we found the following differences (First value for FFRN, second for FFHH)
> /sbin/procd 1408 vs 1388
> /sbin/ubusd 896 vs 888
> /sbin/logd -S 16 1044 vs 1036
> /sbin/netifd 1568 vs 1608
> /usr/sbin/sse-multiplexd 780 vs 0 (doesn't exist)
> radvd versionen 1108 vs 1104
> /usr/sbin/uhttpd 1132 vs 1140
> /usr/sbin/dnsmasq 1076 vs 916
> /usr/bin/fastd 3316 vs 3300
> odhcp6c 800 vs 812
> /usr/sbin/batman-adv-visdata 784 vs 0 (doesn't exist)
> /usr/sbin/dnsmasq 932 vs 924
> respondd 2000 vs 2152
>
> difference sum: 16844 vs 14728 = 2116
This means an increased RAM usage with the newer firmware of over 2MB. But this couldn't be the only source too, because we have nodes without the problem.
Then we started thinking about what we have, and also started writing some documentation of the work for the community. Here we get the idea that the sudden decrease of RAM usage maybe could be caused by the OOM killer. And also the characteristics we see in the RAM graph showed some characteristics of a memory leak. But again this couldn't be the only problem. So we thought again a little bit further and now think it's a combination of mem leak and a mem corruption causing the rereading of the flash storage without an end. With all these information we think that the only service that is really near to the problem is batman-adv-visdata, so this would be the first point to go deeper. But here we come to a limit in resources an knowledge about the system and hope that we find someone who can help us find a solution for this problem.
We know that this are alot of information and maybe alot of information is missing. Please ask if you need something.
You can find a german version including the discussions here: https://forum.ffrn.de/t/workaround-841n-load-neustart-problem/1167/29?u=ben
brenner231:
FF BREMEN
Ach so Bremen, das hatte ich übersehen. Das ist eine Monster-Domain. Da ist das völlig normal. Das ist auch kein Bug, sondern „by Design“.
siehe auch
Das ist mir schon klar, das mit dem Schwächstem …
Machen wir das mal anders…
Wie ist denn bei dir die geschwindigkeit bei Speedtest, und wenn die Downloadzeit für eine 600-700 MB datei…
vlt. gib t es da regionale unterschiede wie in den Images die man sich für die Router runterläd
Jaja werden hier schon meine Beiträge Zitiert … die ich losgetreten habe :-
lg
Aufgrund der Netzgröße sind Geräte mit 32MB RAM von diesem Problem betroffen ja.